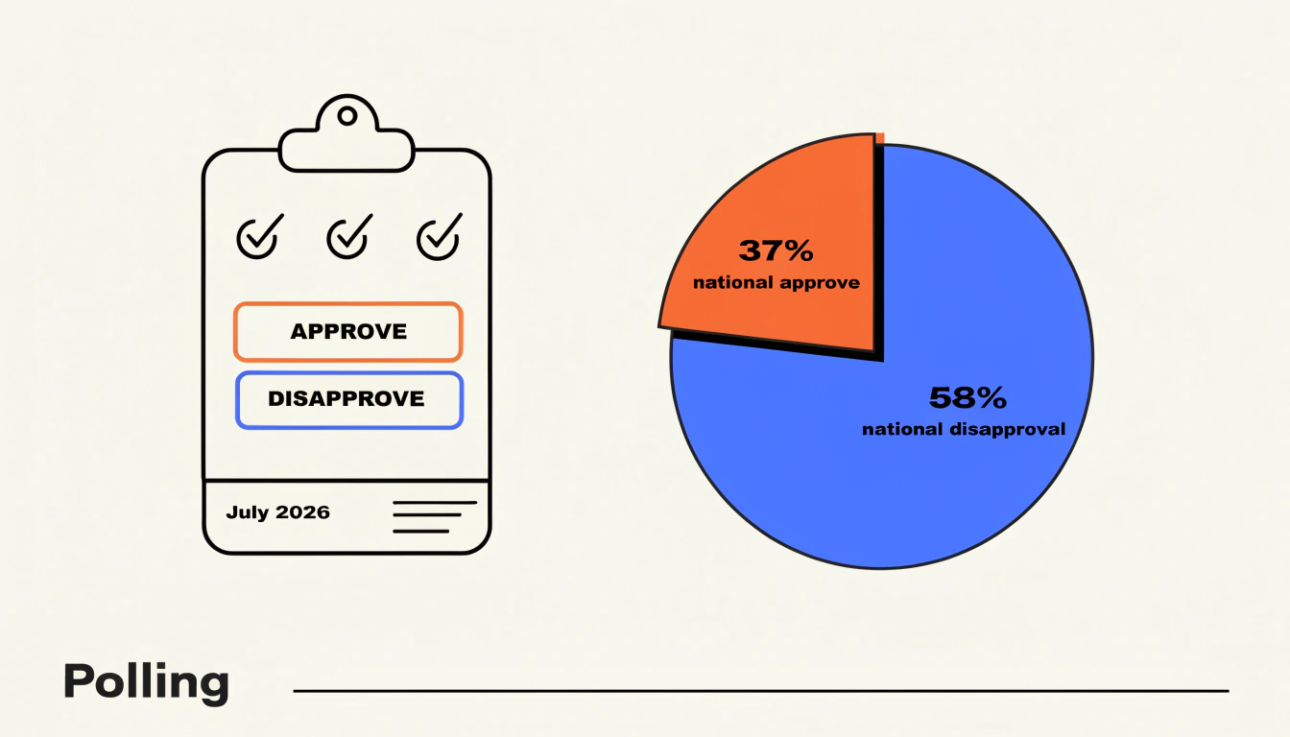
Quick answer: As of July 17, 2026, roughly 18 months into his second term, Donald Trump’s net approval rating (approve minus disapprove) is positive mainly in deep-red states like Wyoming (+24) and North Dakota (+18), while he is underwater in every major swing state, including Pennsylvania (-14), Wisconsin (-15), and Georgia (-21). Nationally, he sits at 37 percent approval versus 58 percent disapproval, a net rating of -21.
Presidential approval maps are one of the clearest ways to see how a president’s support is actually holding up across the country, state by state, instead of just as one national number. Eighteen months into Donald Trump’s second term, the latest state-level polling shows a map that still follows familiar red-versus-blue lines, but with noticeably thinner margins almost everywhere compared to where things stood on Inauguration Day 2025. Here is a full state-by-state breakdown of where Trump’s approval rating stands, based on Civiqs’ rolling online tracking poll of registered voters.
Detail
Figure
National approval
37%
National disapproval
58%
National net approval
-21
Strongest state
Wyoming (+24)
Weakest state
Hawaii (-59)
Swing state status
Underwater in every major battleground state
Poll source
Civiqs rolling online tracker, 117,851 registered voters
Below is the complete state-by-state list of net approval ratings as of July 17, 2026, compared with each state’s starting point on January 20, 2025.
State
Net approval (July 2026)
Net approval (Jan 2025)
Wyoming
+24
+47
North Dakota
+18
+34
West Virginia
+16
+35
Idaho
+14
+34
Alabama
+14
Not specified
Oklahoma
+14
Not specified
South Dakota
+12
Not specified
Tennessee
+7
+25
Utah
+4
Not specified
Indiana
+3
Not specified
Kansas
+3
Not specified
Kentucky
0
+23
Mississippi
-1
Not specified
Nebraska
-1
Not specified
Louisiana
-3
Not specified
Missouri
-3
Not specified
Ohio
-11
+8
Arizona
-11
Not specified
Florida
-12
+9
Texas
-12
+6
North Carolina
-13
0
Pennsylvania
-14
Not specified
Wisconsin
-15
Not specified
Georgia
-21
Not specified
Nevada
-21
0
New York
-37
Not specified
Washington
-40
Not specified
Oregon
-40
Not specified
California
-44
Not specified
Massachusetts
-46
Not specified
Maryland
-50
Not specified
Vermont
-55
Not specified
Hawaii
-59
Not specified
Newsweek’s analysis did not publish a January 2025 starting figure for every one of the 50 states, so several rows above are marked “Not specified” where that baseline number was not part of the released data. The states with confirmed baseline figures show some of the clearest movement over the president’s first 18 months back in office.
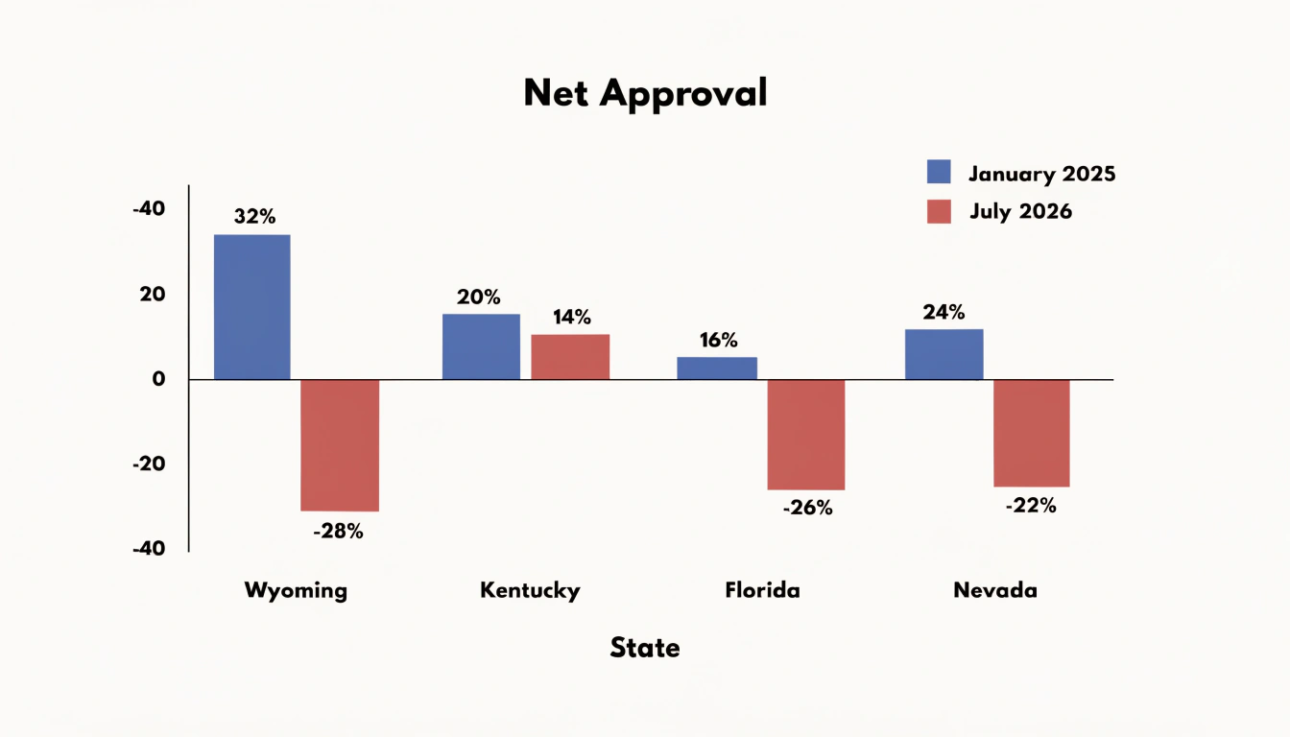
Net Approval: July 2025 vs January 2025 (Selected States)
Wyoming
+24 (was +47)
Kentucky
0 (was +23)
Florida
-12 (was +9)
Nevada
-21 (was 0)
What is Trump’s approval rating in every swing state?
Trump is underwater in every major swing state as of July 2026. Arizona sits at -11, Georgia at -21, Nevada at -21, North Carolina at -13, Pennsylvania at -14, Wisconsin at -15, Florida at -12, and Ohio at -11.
That is a meaningful shift from January 2025. Florida moved from +9 to -12, Ohio fell from +8 to -11, Nevada dropped from an even split to -21, and North Carolina slid from even to -13. None of these deficits are massive on their own, but the pattern is consistent across the entire battleground map, and it means Trump has essentially no cushion left in the states most likely to decide control of Congress. Political scientists have pointed out that this matters because midterm elections often function as a referendum on the sitting president, so sustained negative numbers in these specific states could weigh on Republican candidates running in competitive races.
Which states still show Trump with positive approval?
Trump still holds positive net approval mainly in deep-red states across the Republican heartland. Wyoming leads at +24, followed by North Dakota at +18, West Virginia at +16, and Idaho and Alabama tied at +14. Oklahoma also sits at +14, with South Dakota at +12.
Even in these strongest states, the numbers have slipped noticeably from where they started. Wyoming opened the term at +47 and has fallen to +24. North Dakota dropped from +34 to +18, Idaho fell from +34 to +14, and West Virginia declined from +35 to +16. Kentucky shows the clearest example of erosion, moving from a comfortable +23 at the start of the term all the way down to exactly 0 by mid-2026. The overall picture in red America is one of continued support, but support that is thinner and less automatic than it was on Inauguration Day.
Which states have the lowest approval ratings for Trump?
Hawaii posts Trump’s lowest net approval rating at -59, followed by Vermont at -55 and Maryland at -50. Massachusetts sits at -46 and California at -44, with Washington and Oregon both at -40, and New York at -37.
These states were already deeply negative when Trump returned to office in January 2025, and the pattern here is less about dramatic new movement and more about entrenched opposition simply staying in place. Unlike the battleground states or even some red states, where approval has clearly eroded over 18 months, these deep-blue states largely reflect the same strong disapproval they showed at the very start of the term.
Why has Trump’s approval fallen in Republican-leaning states?
Trump’s approval has dropped the most sharply in some places that gave him his strongest early support, not just in states where he was already unpopular. Wyoming fell 23 points, from +47 to +24. Kentucky also dropped 23 points, from +23 all the way to 0. Idaho declined 20 points, and West Virginia and Tennessee each fell around 18 to 19 points.
Political scientists tracking the trend have pointed to an accumulation of policy concerns rather than any single event. Economic issues like the cost of living and higher gas prices have weighed on his numbers, alongside foreign policy strain connected to the Iran war. The fact that some of the steepest declines are happening in Republican-leaning territory rather than Democratic strongholds suggests that even his core coalition has grown somewhat more critical over time, even if it has not abandoned him outright.
What do the demographic numbers behind the map show?
The demographic breakdown behind the state map shows Trump’s weakest support comes from younger voters, independents, women, and postgraduates. Among adults aged 18 to 34, only 24 percent approve of his job performance while 69 percent disapprove. Among those aged 35 to 49, approval sits at 29 percent against 64 percent disapproval.
Independents lean clearly negative too, with 30 percent approving and 63 percent disapproving. The gender gap is wide: women disapprove by a 64 to 31 margin, while men are far more evenly split, at 51 percent disapprove to 43 percent approve. Education level also plays a major role. Among postgraduates, approval is just 25 percent versus 71 percent disapproval, while non-college graduates show a much narrower gap of 41 percent approve to 54 percent disapprove. These demographic splits help explain the geography of the map itself, since states with larger shares of highly educated or younger voters tend to show weaker numbers for Trump than states with older, less urban populations.
Where does the state approval data come from?
The state-level figures come from Civiqs, which runs a rolling online tracking poll of registered voters that is weighted by demographics and smoothed over time to produce ongoing state and national approval estimates. The most recent Newsweek analysis of this data drew on 117,851 registered voter responses collected since Trump returned to office on January 20, 2025, comparing figures as of July 17, 2026.
Because Civiqs’ method relies on a large in-house panel rather than a single one-time telephone survey, it produces continuous rolling estimates instead of a single snapshot, which is why outlets can track how a specific state’s approval has moved month over month. As with any poll, the numbers carry some margin of error and reflect self-selected online panel respondents, but analysts widely treat approval tracking like this as a reliable general indicator of how public sentiment toward a president is shifting over time.
What has the White House said about the approval numbers?
The White House has consistently pointed back to Trump’s 2024 election victory rather than current polling as its main measure of public support. Administration spokesman Davis Ingle has responded to polling questions by saying “the ultimate poll was November 5, 2024,” arguing that the nearly 80 million Americans who voted for Trump delivered a mandate for his agenda.
Ingle has also framed the administration’s work as ongoing, saying Trump is continuing to deliver on a “popular and commonsense agenda” and describing current efforts as “just the beginning” of that agenda taking effect. That response has remained largely consistent across multiple rounds of polling releases throughout 2026, even as the state-by-state numbers have shown a steady narrowing of Trump’s support in several parts of the map.
What does the approval map mean for the 2026 midterms?
The state approval map matters most right now because of what it could mean for control of Congress in the 2026 midterms. Republicans currently hold a 53-47 majority in the Senate, meaning Democrats need to flip four seats to take control. With Trump underwater in every swing state, Democrats see an opening to compete even in some states he won comfortably in 2024, including Alaska, Iowa, Ohio, and Texas.
The map of available Senate seats still favors Republicans overall. The clearest pickup opportunities for Democrats are Maine, which Trump lost by 7 points in 2024, and North Carolina, which he won by only 3 points. Beyond those two, there are few obvious GOP-held seats in states Trump won by a narrow margin or lost outright. That means Democrats would need to compete successfully in tougher territory to meaningfully expand the battleground.
Political scientists have noted that midterms function historically as a referendum on the sitting president’s party. In 2022, under President Biden, Democrats lost nine House seats. In 2018, during Trump’s first term, Republicans lost 40 seats. With Trump’s approval sitting in the high 30s nationally and negative across every battleground state, analysts have suggested his numbers could shave points off Republican candidates in close races, giving Democrats a better shot in contests currently viewed as toss-ups or even slightly Republican-leaning.
FAQ
What is Trump’s national approval rating right now?
As of July 17, 2026, Trump’s national approval rating stands at 37 percent, with 58 percent disapproval, for a net approval of -21, according to Civiqs.
What state has the highest approval rating for Trump?
Wyoming has Trump’s highest net approval rating at +24, though that figure is down significantly from +47 when he started his second term.
What state has the lowest approval rating for Trump?
Hawaii has Trump’s lowest net approval rating at -59, followed closely by Vermont at -55 and Maryland at -50.
Is Trump underwater in every swing state?
Yes, as of July 2026, Trump has negative net approval in every major battleground state, including Arizona, Georgia, Nevada, North Carolina, Pennsylvania, Wisconsin, Florida, and Ohio.
References
Newsweek, “Map Shows Trump Approval Rating in Every State After 18 Months” (2026)
Newsweek, “Map Shows Donald Trump’s Approval Rating in Every State on July 4” (2026)
Newsweek, “Map Shows Trump’s Approval Rating in Each State After 17 Months” (2026)
Newsweek, “Map Shows Trump Approval Rating in Every State After 16 Months” (2026)
Newsweek, “Map Shows Trump Approval Rating in Each State With Critical Senate Races” (2026)
Yahoo News, “Map shows Donald Trump’s approval rating in every state after 17 months” (2026)
Sarah Anderson . J
I’m the mom behind Wise Mom Blogger, where everyday creativity meets real-life motherhood. I share easy DIY crafts, cozy knitting and crochet projects, beginner-friendly sewing ideas, and family-tested recipes—plus quick baking hacks that make homemade feel doable on busy days.